
RMSConnect
Newsletter
October 2016
Featured
Going Granular to Understand Hurricane Matthew
READ ![]()
Exposure Manager: A Global Launch
READ ![]()
Make Regulatory and Rating Agency Compliance Easier For Your Business
READ ![]()
Did We See You at an RMS Event in September?
READ ![]()
First RMS High-Definition (HD) Models Now Released
READ ![]()
Be Better Informed about Hurricanes with RMS HWind
READ ![]()
Get the Latest on New RMS Event Response Procedures
READ ![]()
New Executive Briefing on 2017 North Atlantic Hurricane Models Update
READ ![]()
Europe Inland Flood Data – Now Available
READ ![]()
New Directional Loss Guidance for North America Earthquake Models
READ ![]()
Learn about the New and Updated RMS Models for Asia in Version 17
READ ![]()
The Rise and Stall of Terrorism Insurance
READ ![]()
Download Your Copy of Exposure Magazine
READ ![]()
Fire Weather
READ ![]()
Keeping Up with Cyber Risk
READ ![]()
 Featured
Going Granular to Understand Hurricane Matthew
Perhaps September 28, 2016 doesn’t stick out in your memory. It was a Wednesday. Both America and Europe were locked in a battle on this day, on a Minnesotan golf course, fighting for supremacy in the Ryder Cup. But this day also marked the development of a tropical storm named Matthew, some 35 miles (56 kilometers) southeast of St. Lucia.
Going back almost a year before, in October 2015, RMS® welcomed HWind to the organization, regarded as the leading real-time hurricane-impact data service. Dr. Mark Powell, who invented the HWind methodology and founded HWind Scientific, joined RMS as vice president, model development, together with his team. With HWind now part of the RMS family, what would be the impact of HWind’s activities with regards to an event such as Hurricane Matthew?
For a live event, HWind provides regularly derived snapshots of wind field conditions leading up to and following landfall, together with post-event wind hazard footprints produced 1-3 days following tropical cyclone landfall. From 1500 UTC on September 28, HWind started producing snapshot images, mapping files, and gridded hazard files depicting wind field size and intensity via one-minute sustained winds and three-second peak gusts. Data coverage maps, which showed observational data sources informing each snapshot, were also produced.
Every three to six hours, until 0900 UTC on October 9, and Hurricane Matthew’s departure into the Atlantic from the coast of North Carolina, the HWind team created and delivered new snapshots. These snapshots alone represented the most frequently updated real-time source of information, twice as frequent as many publicly available sources.
The data flowed from dozens of real-time airborne, land, and sea-based sources. These ranged from the United States Air Force 53d Weather Reconnaissance Squadron (AFRC), nicknamed the “Hurricane Hunters”; NOAA Lockheed WP-3D Orions equipped with airborne Doppler radar, two Advanced Scatterometer (ASCAT) satellites and GPS dropsondes parachuted in from observation planes. These small sondes, around 16 inches (40 cm) in length and weighing no more than a pound (0.45 kg), are parachuted in from up to 30,000 feet to measure air temperature, pressure, humidity, wind speed and direction. All these sources together result in tens of thousands of observational data points throughout the event.
With such a range of sources regularly contributing to the data feed across the basin, the HWind methodology was able to create a continuous representation of the wind field from start to finish, broken out minute-by-minute. Three-hour snapshots are vital to understanding evolving storm conditions during the event, while the continuous wind field footprint offers exceptional retrospective insight into hazard extent and severity. Thanks to the sheer range of data sources and model science, both the snapshots and post-event footprints are refined to offer unprecedented granularity and resolution into tropical cyclone wind hazard.
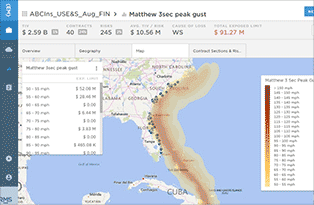
Both RMS and our clients took full advantage of HWind Real-Time Analysis Data via RMS Owl to assess exposure accumulations at risk, inform accurate deployment of claims adjusters, and estimate potential claims counts. If HWind post-event footprints are then used with Exposure Manager, powered by the RMS(one)® platform, the full benefits of the real-time footprints are realized, to accurately analyze a portfolio’s exposure by drilling down into deterministic loss drivers across geographies accounts, or lines of business. Whether a client wants to analyze by banded one-minute sustained winds or three-second peak gusts, the information is just a few clicks away.
Looking at Hurricane Matthew, HWind delivers a new level of frequency, depth of coverage and granularity, which helps RMS and our clients respond more effectively to events – and coupled with Exposure Manager, the data comes to life, helping clients take control.
For more information or access to a free HWind trial, please contact your account manager. For more information on Exposure Manager, click here.
Exposure Manager: A Global Launch
At launch events in London, New York, and Bermuda, Exposure Manager on the RMS(one)® platform generated a great deal of interest from clients looking to revolutionize how they visualize and manage exposure data in their portfolios. Watch a quick overview video or see a demo now.
Making Regulatory and Rating Agency Compliance Easier for Your Business
Did you know that RMS has a dedicated regulatory affairs team, who offer support to RMS clients for all regulatory needs? The team's remit also includes governmental compliance services and support for insurance regulators, rating agencies, and governmental institutions across North America; and across Europe to support the management of catastrophe risk under Solvency II.
RMS engages in numerous global regulatory support activities from interacting with regulators and rating agencies, providing education around the use and understanding of catastrophe models, through to regulatory-related business support.
Helping Clients with Solvency II
With Solvency II now in force across Europe, RMS has the expertise and tools to meet clients’ current and future Solvency II requirements. RMS offers unprecedented transparency into our models, offering market-leading support in justifying model use, selection, and appropriateness, and ensuring users have complete confidence in our model strengths and limitations. We do this by providing clients, regulators, and rating agencies with unique insights into underlying model assumptions, calibration and validation processes, model change impacts, key uncertainties, non-modeled issues, and model sensitivity testing recommendations. RMS leads the market in model documentation and has a dedicated documentation team to fulfill Solvency II governance and use test documentation requirements. For instance, there are over 1,000 pages of easily accessible documentation just relating to our Europe Windstorm Model, providing evidence to support and explain model justification. RMS also offers direct access to RMS scientific experts, model developers, and engineers to enhance model understanding and use.
To help with increasing regulatory demands, let the dedicated team at RMS support you and all your regulatory-related needs. Please contact your account representative for more information.
Did We See You at an RMS Event in September?
Last month saw a series of RMS industry events held across Asia, Europe, and the United States to help inform the market about our models, data, software releases, and roadmap.
The first event was our annual RMS In:Site Singapore on September 1, which had more than 100 attendees and focused on our current and future developments for the Asia Pacific region. Many of the new and updated RMS regional models, including two of our first three high-definition models, were covered in detail. The event also explored our software strategy and the RMS(one)® family of solutions. The day finished with two top-of-mind topics: cyber and marine cargo and specie risk.
The latter included a panel on marine risk featuring the perspectives of local marine industry experts moderated by Paul Burgess, senior director at RMS.
Between September 9 and September 26, RMS hosted a series of version 17 seminars in Zurich, London, Hoboken, and Bermuda, all of which were extremely well attended. The agenda started with a brief overview of the RMS models, data, and software roadmap before moving to the main discussion, which featured detailed presentations on the new and updated models and solutions that will be released in version 17, scheduled for spring 2017. Afterward, attendees and other RMS clients joined post-seminar receptions to celebrate the launch of Exposure Manager on the RMS(one)® platform and, in Zurich, the 10-year anniversary of the RMS office's opening.
First RMS High-Definition (HD) Models Now Released
RMS has released the first three high-definition (HD) models to the market: Europe Inland Flood HD Models, Japan Typhoon HD Model, and New Zealand Earthquake HD Model. This release has been accompanied by the publication of several documents on RMS Owl, including Model Methodology and Understanding Changes in Results documents. We have also released new or updated Industry Exposure Databases for each of the HD models.
After socializing the model results in recent months with development partners and at industry events, such as Exceedance and model launches, this release represents a major broadening of access to model losses and the drivers of change for all licensing RMS clients.
Documentation now available includes:
Europe Inland Flood HD Models: Methodology
Europe Inland Flood HD Models: Understanding Changes in Results
Japan Typhoon HD Model: Methodology
Japan Typhoon HD Model: Understanding Changes in Results
New Zealand Earthquake HD Model: Methodology
New Zealand Earthquake HD Model: Understanding Changes in Results
Model Methodology documents are available to all RMS clients, but Understanding Changes in Results documents are only available to clients who license our models. Please contact your account manager if you would like more information on accessing these documents.
Be Better Informed about Hurricanes with RMS HWind
RMS HWind is renowned in the market as the "ground truth" for tropical cyclone wind assessment across all event stages. It provides real-time and historical wind field analyses for tropical cyclones in the western North Atlantic, Eastern Pacific, and Central Pacific basins. It is comprised of two solutions: HWind Real-Time Analysis and HWind Enhanced Archive.
HWind Real-Time Analysis includes regularly derived snapshots of current wind field conditions before, during, and following landfall. Event analyses are based on the latest observations from more than 30 different data sources, including aircraft reconnaissance, dropsondes, buoys, and satellites. Post-event wind hazard footprints are produced 1-3 days following tropical cyclone landfall. Taken together, these features inform better preparation and response to dynamic storm conditions in real time.
HWind Enhanced Archive is a catalog of high-resolution impact images, snapshots, and footprints of wind hazard characteristics from historical tropical cyclones over the last 20+ years. The archive relies on the same underlying science and methodology as used in HWind Real-Time Analysis, plus post-event analysis and data not available the time of the event. Users can validate historical experience against modeled wind field characteristics and losses, while also supporting regulatory requirements when developing a custom view of risk.
HWind Real-Time Analysis is now live on RMS Owl, and includes data for both Hurricane Matthew and Hurricane Nicole, among other 2016 storms. Beginning this fall, storm data in the first version of HWind Enhanced Archive will be accessible via RMS Owl. Please contact [email protected] or your RMS account manager to learn more and to request access. For more information, visit the new RMS HWind pages on our website or take a look at the RMS HWind datasheet.
Get the Latest on New RMS Event Response Procedures
The RMS event response team has updated the Event Response Overview and Best Practices document on RMS Owl. New in 2016 are event response procedures for European flood and U.S. severe convective storm. RMS has also updated the modeling procedure for European windstorm event response that now includes the hazard ensemble footprint method new for the 2016-2017 windstorm season.
New Executive Briefing on 2017 North Atlantic Hurricane Models Update
In spring 2017, RMS will release a comprehensive update to the North Atlantic Hurricane Models, including updates to the view of hurricane risk in all modeled regions, as part of the version 17 software release. Version 17 reflects the latest hurricane landfall frequency data and building vulnerability research, enabling RMS to continue to comply with the standards of the Florida Commission on Hurricane Loss Projection Methodology.
Version 17 long-term event rates incorporate an update of the HURDAT2 historical hurricane database and a new medium-term rate forecast, which considers the latest peer-reviewed scientific literature regarding the future near-term state of the Atlantic Basin. Vulnerability updates, including damage-curve recalibrations in Hawaii and the Caribbean, reflect detailed reanalysis of claims data, comprehensive research of building codes, and insight from the Institute of Business and Home Safety.
RMS plans to publish, in time for mid-year renewal work, a suite of preliminary version 17 long-term and medium-term rate sets for use in existing RiskLink® and RiskBrowser® environments. For more information, read the North Atlantic Hurricane Models Executive Briefing #1: Scope and Rationale Version 17.0 document. RMS will provide additional insight into quantitative impacts on model results in early 2017, ahead of the model release.
Europe Inland Flood Data – Now Available
RMS has released the remaining Europe Inland Flood Peril Rating Databases (PRDs), which are now available for download via RMS Owl. The PRDs can be used alongside the hazard maps to form a complete underwriting solution across risk selection and pricing that covers 13 countries. The databases have been created using our market-leading flood hazard and vulnerability modeling expertise, providing annual loss ratios for exposure at risk of flooding and supporting exposure screening and rating at the point of underwriting.
The suite of PRDs will be expanded in the coming months to cover the risks of windstorm and earthquake across Europe. The databases will provide differentiated peril-specific hazard and annualized loss rates for 16 RMS occupancies covering both residential and commercial lines of business. The PRDs can be used as stand-alone underwriting tools or in conjunction with one another to effectively price risks that are exposed to multiple perils.
Products that have been released:
- Europe Inland Flood Maps for 12 countries (U.K. pending)
- Europe Inland Flood XMLs for 13 countries
- Europe Inland Flood PRDs for 13 countries
Products to be released in the coming weeks and months:
- Europe Inland Flood Maps for the U.K.
- Europe Modified Mercalli Intensity (MMI) Hazard Maps for 12 countries
- Europe Windstorm PRDs for 13 countries
- Europe Earthquake PRDs for 12 countries
If you would like to understand more about any of the currently available or upcoming data products, please contact your RMS account manager.
New Directional Loss Guidance for North America Earthquake Models
In spring 2017, RMS will release a comprehensive update to the North America Earthquake suite of models for the United States, Canada, and Mexico. An accelerated communication plan is in place to help clients prepare for this new view of risk.
The version 17 release will be a comprehensive update that incorporates data from the 2014 U.S. Geological Survey (USGS) National Seismic Hazard Mapping Project and the Geological Survey of Canada and includes the latest scientific view of the Mexico Subduction Zone. The release will also incorporate enhancements to liquefaction, landslide, ground motions, soil amplification and basins, fire following earthquake, tsunami, casualty, vulnerability, and industry exposure databases (IEDs).
For more information on directional loss guidance for this update, read the Directional Loss Executive Briefing and review the webinar, both available on RMS Owl. For more information on the full scope of the updates, visit RMS Owl to read Executive Briefing #1: Scope and Rationale and the Scope of Update and watch the accompanying scope webinar.
Learn about the New and Updated RMS Models for Asia in Version 17
RMS is releasing new or updated products for many Asian countries, including new earthquake and typhoon models that demonstrate our commitment to applying the latest modeling science in the region.
Southeast Asia Earthquake Models
A new regional earthquake model for Indonesia, the Philippines, Singapore, Malaysia, Thailand, and Vietnam uses an expanded seismic source catalog and the latest generation of ground motion prediction equations to produce a stochastic event set that delivers seismic hazard across the region. The release will also include hazard enhancements to liquefaction, landslide, ground motions, and soil amplification, plus country-specific vulnerability models including detailed building inventories. The model release for each of the six countries is supplemented by an industrial facilities model (IFM), builders risk module (BRM), economic exposure databases (EEDs), and industrial clusters catalogs.
South Korea and Taiwan Typhoon Models
In RiskLink® version 17, RMS will be releasing two new typhoon models for South Korea and Taiwan. These models will allow for the comprehensive assessment of risk from three related typhoon perils: wind, typhoon-driven inland flood, and storm surge. The models include the latest RMS science and innovations in typhoon wind and flood modeling, including the most advanced extra-tropical transitioning model on the market. An industrial facilities model (IFM), industry exposure databases (IEDs), and industry loss curves (ILCs) will also be available for both countries to supplement the typhoon model releases.
For more information on the scope of the version 17 models for Asia, please refer to the datasheets on the RMS website: Southeast Asia Earthquake Models, South Korea Typhoon Model, and Taiwan Typhoon Model. Executive briefing and scope documents will be available on RMS Owl later this year. Please contact [email protected] or your RMS account manager to learn more.
The Rise and Stall of Terrorism Insurance
Chris Folkman, who heads up strategic development of RMS terrorism models, explores some of the reasons why terrorism insurance demand remains flat and whether it's time for terrorism insurance to innovate and evolve in this RMS blog.
Download Your Copy of Exposure Magazine
Our new Exposure magazine brings together topics of special interest to catastrophe and risk management professionals with a mix of articles examining perils and regions, industry issues, and what's coming up for our industry. Download your copy now.
Fire Weather
Robert Muir-Wood, chief research officer at RMS, examines the effect that weather has on fire, from how tinder-dry conditions helped spread the Great Fire of London to the gale-force winds that drive Canadian firestorms in his RMS blog.
Keeping Up with Cyber Risk
The cyber threat landscape changes and evolves at a fast pace, so RMS constantly researches events to incorporate the latest views into our cyber products. Tom Harvey, product manager for cyber, looks at what has been a busy year for cyber threats in 2016 on the RMS blog.

Sales Inquiries - [email protected]
Product
Support - [email protected]
+1.510.505.2500 or +44.20.7444.7600
![]()
![]()
![]()
![]()
![]()
![]()
RMS
7575 Gateway Blvd., Newark, CA 94560
Privacy Policy